Getting Started with Arduino Uno

Start your First Arduino project with following steps :

1. Install the Arduino IDE:

   - Download and install the Arduino IDE from the official 

[Arduino website](https://www.arduino.cc/en/software).


2. Connect the Arduino Uno:

   - Use a USB cable to connect the Arduino Uno to your computer. The power LED on the board should light up.


3. Write Your First Program:

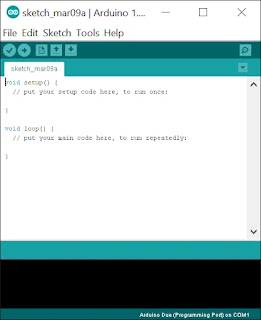
   - Open the Arduino IDE and write a simple program, known as a "sketch". 

   - Get the code from From my Github Click here 

Requirements :

                   1. Arduino UNO

                   2. Led

4. Connection:

   - Connect LED +ve pin to the 13 pin and -ve pin to GND in Ardui


5. Upload the Sketch:

   - Select your board (Arduino Uno) and port from the Tools menu, then click the upload button. The built-in LED on the board should start blinking on and off every second.


Conclusion :

                    By completing these steps you can easily compile and run the code. For further updates kindly be connected.

Comments

Popular posts from this blog

Unlocking Insight: The Power Trio of Data Visualization Tools

Introduction : In the age of big data, understanding information is paramount, and data visualization tools are the key. These tools not only make complex data digestible but also reveal patterns and insights that might otherwise remain hidden. Let's delve into three essential tools revolutionizing the landscape of data visualization. 1. Tableau: Tableau is the Swiss Army knife of data visualization. Its intuitive interface allows users to create interactive dashboards and reports without the need for complex coding. With drag-and-drop functionality, users can seamlessly connect to various data sources and visualize insights in real-time. Whether you're a beginner or an advanced analyst, Tableau's robust features empower you to explore data in-depth and present compelling narratives. 2. Power BI: Microsoft's Power BI is another heavyweight contender in the data visualization arena. Integrating seamlessly with Microsoft's ecosystem, Power BI offers unparalleled flexi...

Introduction

Welcome to the crossroads of innovation and coding expertise! Follow Samuvel Raja S as we delve into the dynamic world of Internet of Things (IoT) and programming languages. Explore the art of crafting smart devices while mastering Python, C, C++, Java, and more. Unleash your creativity and dive deep into the boundless potential of IoT. Join us on this thrilling journey where every line of code ignites endless possibilities!

Seeing Beyond Numbers: The Art and Science of Data Visualization

In today's data-driven world, the ability to extract meaningful insights from vast amounts of information is paramount. However, raw data alone often fails to convey its significance effectively. This is where data visualization steps in as a powerful tool for transforming complex datasets into understandable and actionable insights.   Data Visualization Data visualization is the graphical representation of data and information. It utilizes visual elements such as charts, graphs, and maps to present data trends, patterns, and relationships in a format that is easily comprehensible to viewers. By translating numbers and statistics into visual forms, data visualization enables analysts, researchers, and decision-makers to grasp complex concepts quickly, identify correlations, and communicate findings with clarity and impact.   Conclusion : In today's data-driven world, the ability to interpret and communicate insights effectively is a competitive advantage. Whether you'...