
Electronics
Welcome to my electronics blog, your gateway to exploring the exciting world of circuits, gadgets, and cutting-edge tech!
Read More.....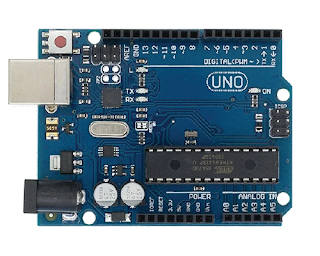
Arduino Uno board
Discover the essentials of the Arduino Uno, a versatile microcontroller perfect for beginners and hobbyists, and start creating your own interactive electronic projects today!
Read More.....
Getting Starting with Arduino IDE
Getting started with the Arduino IDE involves installing the software, connecting your Arduino board via USB, selecting the correct board and port from the Tools menu, and uploading an example sketch to test your setup.
Read More.....
Getting Starting with Ulsonic Sensor with Arduino UNO
Discover how to use ultrasonic sensors with an Arduino Uno to accurately measure distances and create versatile, obstacle-detecting projects with ease.
Read More.....
Measuring Distance with an Ultrasonic Sensor Using Arduino
A step-by-step guide to understanding and implementing ultrasonic distance measurement with Arduino, including a detailed explanation of the code.
Read More.....
Comments
Post a Comment